
Issue-Based Information Systems and Dialogue Mapping
When I was introduced to the concept of modeling languages, I was at the start of business school, having spent most of the past decade in various project management and business analyst roles. Some of the more interest projects I had participated in were not just about execution of a clearly defined plan, but many times myself and my team were handed huge problems — with no clear resolution. And so I started reading up on various management and business books that explored the topic of systems-based planning and team-based problem solving.
During one of our very first school projects while white boarding a few scenarios and possible solutions, I was first introduced to the unified modeling language (UML) as a method for visualizing the various actors, use cases, and scenarios of our problem. Of course, there were limitations to the notation outside of software and systems design: although its advocates claimed it could fit any situation, it wasn’t designed, necessarily, for solving business planning issues.
A few years earlier I had been formally trained in the joint application design, or rapid application design (JAD/RAD) method, which followed the premise that shared understanding was core to problem solving, and that by locking stakeholders together in a room (sometimes literally) as you extract requirements and develop a prototype, forcing people to come together and agree on those requirements and design produced solutions that better met all stakeholder needs and expectations.
While JAD is great for the development of a website or user interface, it requires a lot of up front planning, preparation, and coordination to be successful, and does not prescribe any specific notation for visualizing a problem or solution. In subsequent years, I moved between some of these JAD techniques, UML, and various tools and templates picked up during business school, or played with Visio and Balsamiq as a way to help me to put my ideas in a visual format that others could understand, allowing us to create a shared vision of the problem and our agreed upon path forward.
A few years back, I participated in a workshop in Bellevue, Washington led by my good friend and Business Applications MVP Paul Culmsee (@paulculmsee), that focused on the use of the issue-based information systems (IBIS) model for problem solving. The goal of IBIS is to help people plan and, more importantly, coordinate (meaning with other people) the decision process beginning with an issue or question, and working through possible issues, questions, pros and cons. IBIS is used in various visualization techniques, such as the facilitation technique called dialogue mapping.
What is dialogue mapping? From the CogNexus Institute website:
Dialogue Mapping™ is a radically inclusive facilitation process that creates a diagram or ‘map’ that captures and connects participants’ comments as a meeting conversation unfolds. It is especially effective with highly complex or “Wicked” problems that are wrought with both social and technical complexity, as well as a sometimes maddening inability to move forward in a meaningful and cost effective way.
Dialogue Mapping™ creates forward progress in situations that have been stuck; it clears the way for robust decisions that last. It is effective because it works with the non-linear way humans really think, communicate, and make decisions.
Seeing this method in practice during the workshop made it all click for me, and how the use of IBIS and dialogue mapping was better geared for visualizing the breadth of business and technical problems we all face in our jobs. Paul wrote a series on dialog mapping back in 2009 that explains how IBIS works. In his first article, he illustrates how IBIS can be used to outline a problem by using Frodo from the Lord of the Rings story:
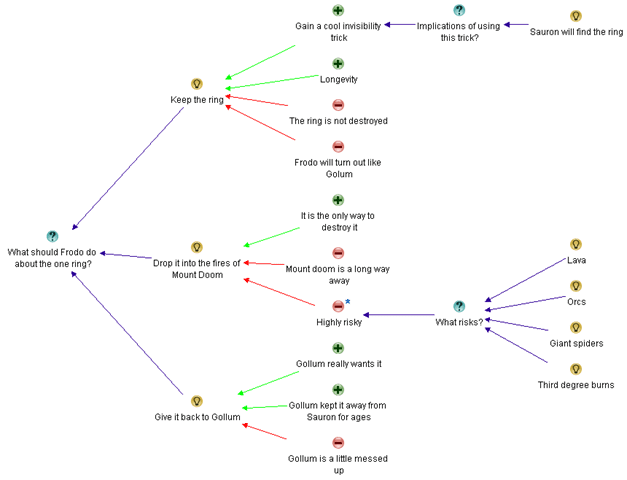
Dialogue Mapping example from Paul Culmsee at CleverWorkarounds.com
Beginning with Frodo’s dilemma, the notation outlines each of his options, the pros and cons of each option, and any additional/supporting questions or facts that may provide additional clarity to each position. If you were part of a management team with the directive to decide what to do with the One Ring that Frodo holds, this model would give you a clearer picture of the many options and risks so that your plan can mitigate each of them accordingly. Frodo didn’t have all of this data at the beginning of his journey — these facts came to light as he traveled Middle Earth on his quest. Most of our IT projects, however, begin with enough data and requirements and directives to piece together a visualization of the problem, from which decisions can be made. Most people just never take the time to lay out all of the facts.
Spending close to 25 year in the information technology space, I have had far too many experiences with decisions made with little to no information. Unfortunately, for many people, the crutch question we lean on too heavily is “What are your requirements?” But we approach this without a real strategy in how to take those requirements, map them up against our existing systems or processes, and correlate them with other inputs and requirements. Instead, we rely heavily on our personal experiences (which are often very limited) and wilt at pressure from management to make *some* kind of decision.
One of the tools we used in business school, and which I often mention in presentations to the SharePoint community, was the House of Quality (Wikipedia image below). The point in my sharing this is not to have you run out and use it, although it has its applications, but because it is a great way to illustrate that having a visualization of your problem — in this case, an outline of customer requirements weighted against your capabilities and priorities — often leads to solutions that may not be obvious.
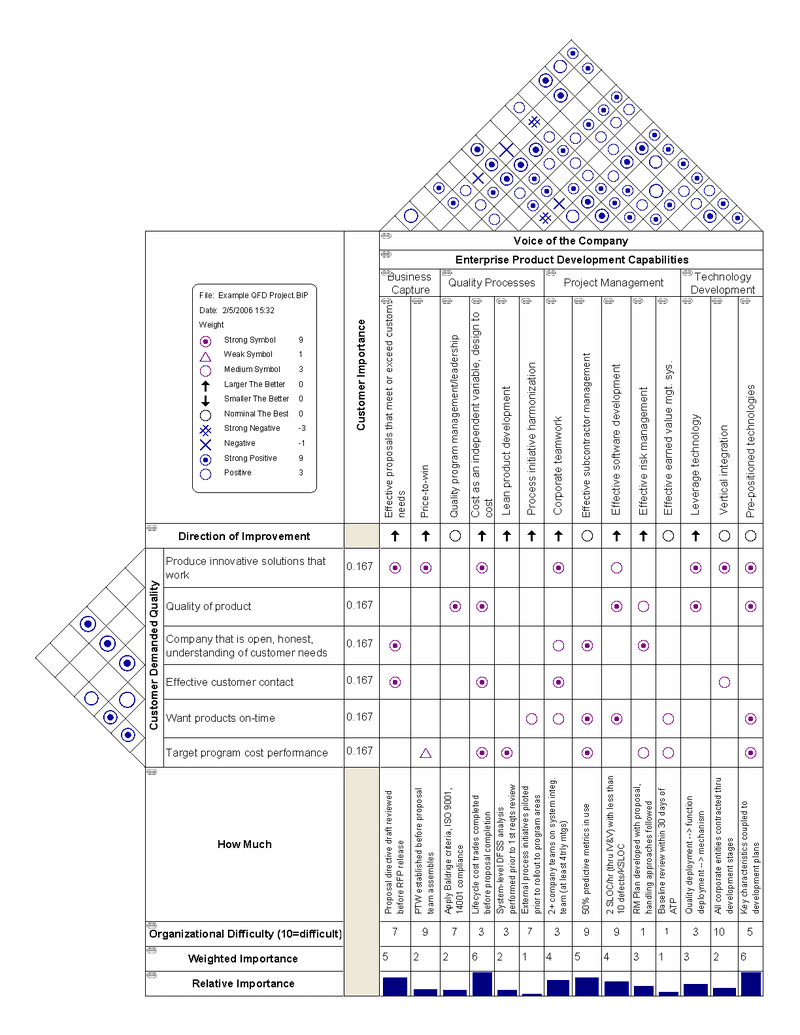
House of Quality template shared on Wikipedia
I am not an expert in dialogue mapping, but as I spend more and more time working with clients to solve their business issues, as well as in helping my own company develop and grow, I am seeing more and more applications for these visualization techniques. If you’re interested in learning more, be sure to check out Paul’s blog Clever Workarounds and his series on Dialogue Mapping, Part 1, Part 2, Part 3, and Part 4.


1 Response
[…] Issue-Based Information Systems and Dialogue Mapping [buckleyPLANET] […]